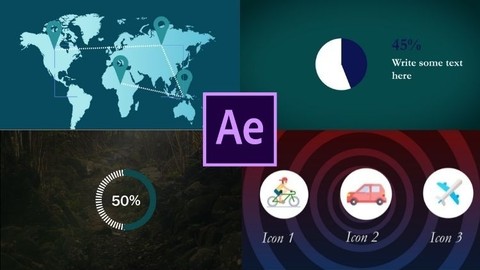
Adobe After Effects: Infographics & data visualization
Learn how to use Adobe after effects To Create infographics & data visualization
What you’ll learn
-
Create Animated infographics: line Graphs, Bar Charts and Pie Charts
-
Use special effects and presets to create graphs
-
Understand and Use expressions to help create charts
-
Apply pro techniques to change graph values
Requirements
-
Beginner’s knowledge in After Effects
-
Adobe After Effects ver CS6 and beyond
-
want to improve your creative skills
Who this course is for:
- After Effects users who want to develop their skills using expressions
- anyone who work with data to present with infographics
- Anyone that want to learn to create animated infographics
- Motion Graphics Designers


