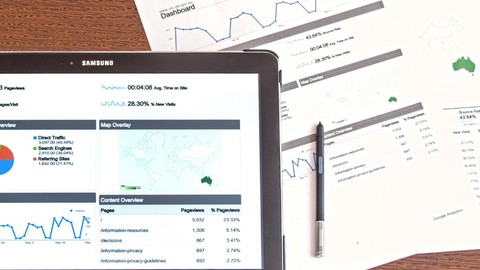
Google Analytics Reporting with Google Data Studio
Learn how to create custom Google Analytics dashboards, reports and do data analysis using Google Data Studio
What you’ll learn
-
Connecting Google Analytics Data with Google Data Studio
-
Google Data Studio Interface Overview
-
Scorecard Visualization
-
Adding Date Range Control Filter
-
Area Graph
-
Column and Bar Graphs, Drill Down and Interaction Filter Feature
-
Time Series Graph
-
Cumulative Time Series Graph
-
Geo Graph
-
Pie Chart Visualization
-
Pivot Table Visualization
-
Table Visualization
-
Use of Filters in Google Data Studio
-
Creating and Sharing Interactive Dashboards
Requirements
-
No. This course covers everything from beginner to advanced
Who this course is for:
- Digital Marketers interested in Google Data Studio
- Digital Marketing Managers
- Digital Marketing Freelancers
- Website Owners
- Business Owners
- B2B & B2C Marketeers
- Demand Generation Managers
- Digital Marketing Specialists
- Digital Analytics Students
- Marketing Analytics Students
- Sales Manager
- Marketing Manager
- Sales Vice President
- Marketing Vice President
- Director of Sales
- Marketing Director
- Chief Sales Officer
- Chief Marketing Officer
- Chief Executive Officer


